È un caldo marzo romano. Io sto bevendo un amaro Montenegro. Sapore vero. “Pronto? Ciao Federico, dimmi.” “Si? Il mio webinar è piaciuto molto? Bene. Ah, l’hanno letto in tanti nella tua azienda? Beh, sono contento. Ah, c’è dell’altro? Se m’interessa presentare il mio lavoro al Festival del giornalismo? Beh, si, ma non so se More
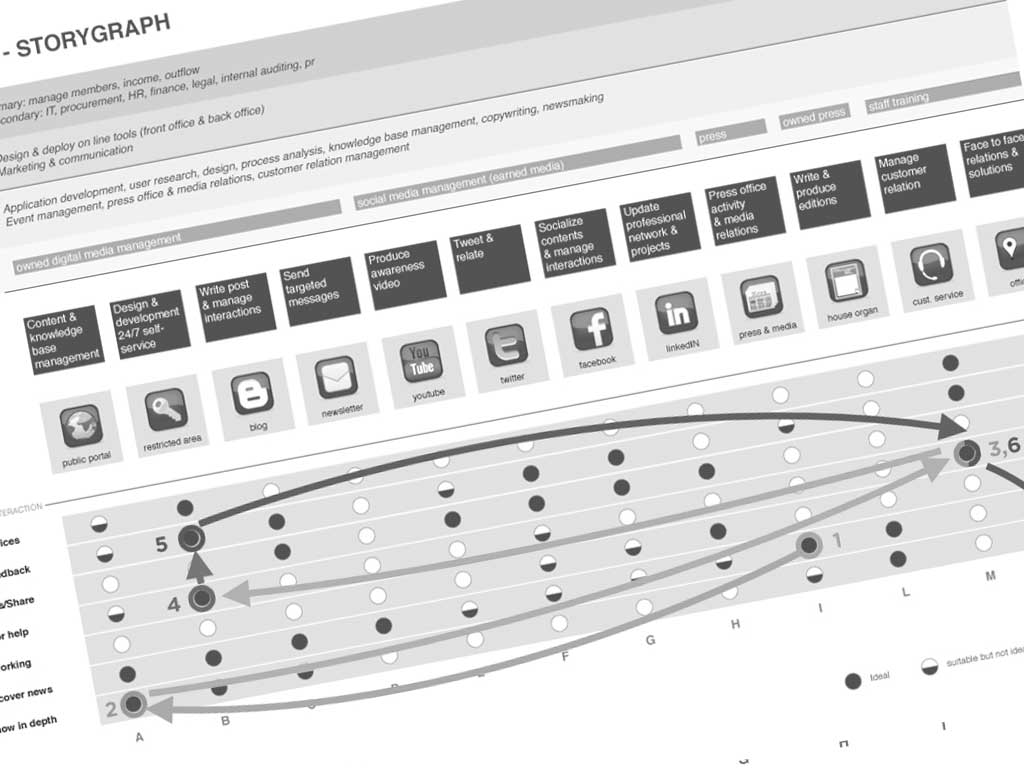
In the last post I've introduced the storygraph as new deliverable to visualize the user needs/touchpints grid. Now I want to show how the storygraph had become a tool for discovering common user journeys. I'm a designer with a background in anthropology. My whole career is made of encounters as a common space of dialogue and exchange. Every researcher More
The storygraph is a deliverable I made to visualize the user needs/touchpoint matrix. Then it became a powerful tool, but let’s start from the beginning. Two years ago I was trying to represent how people interact with a whole system, over time and space. Call it by other names: cross-channel experience design, multi-channel service design, More
This website uses cookies to improve your experience. We'll assume you're ok with this, but you can opt-out if you wish.AccettaVoglio saperne di più
Privacy & Cookies Policy
Privacy Overview
This website uses cookies to improve your experience while you navigate through the website. Out of these, the cookies that are categorized as necessary are stored on your browser as they are essential for the working of basic functionalities of the website. We also use third-party cookies that help us analyze and understand how you use this website. These cookies will be stored in your browser only with your consent. You also have the option to opt-out of these cookies. But opting out of some of these cookies may affect your browsing experience.
Necessary cookies are absolutely essential for the website to function properly. This category only includes cookies that ensures basic functionalities and security features of the website. These cookies do not store any personal information.
Any cookies that may not be particularly necessary for the website to function and is used specifically to collect user personal data via analytics, ads, other embedded contents are termed as non-necessary cookies. It is mandatory to procure user consent prior to running these cookies on your website.

 In the last post I've introduced the storygraph as new deliverable to visualize the user needs/touchpints grid. Now I want to show how the storygraph had become a tool for discovering common user journeys. I'm a designer with a background in anthropology. My whole career is made of encounters as a common space of dialogue and exchange. Every researcher More
 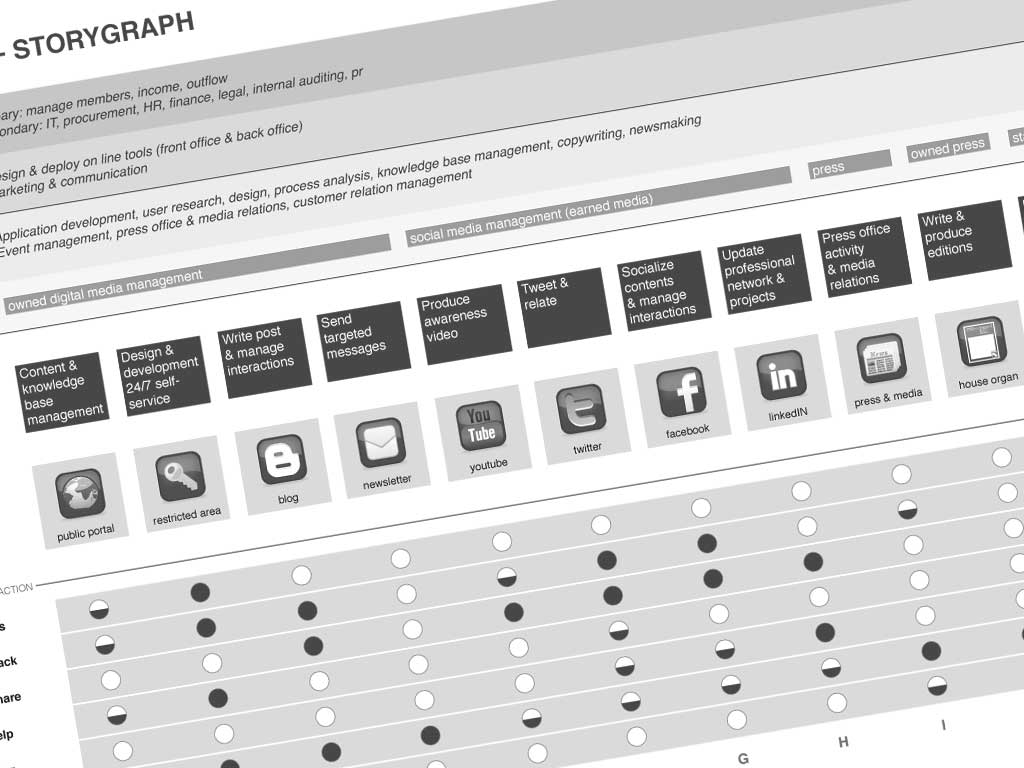 The storygraph is a deliverable I made to visualize the user needs/touchpoint matrix. Then it became a powerful tool, but let’s start from the beginning. Two years ago I was trying to represent how people interact with a whole system, over time and space. Call it by other names: cross-channel experience design, multi-channel service design, More