
About Me
UX unicorn, Professor @Polimi, Co-founder @fifthbeat, anthropology background, father, rugby addicted. Views are mine | Please feed my curiosity!More about me or read blog archives
Blog
Google Databoard: explore research data and create your own infographics
There are several key factors which impact a company’s decision how to shape their business. User reasearch, market data, context analysis are a life jacket to stay up to date about the most recent insights. Unfortunately — with a lot of studies and with data being constantly updated — it’s almost impossible to keep up. More
Work
-
Introducing the storygraph
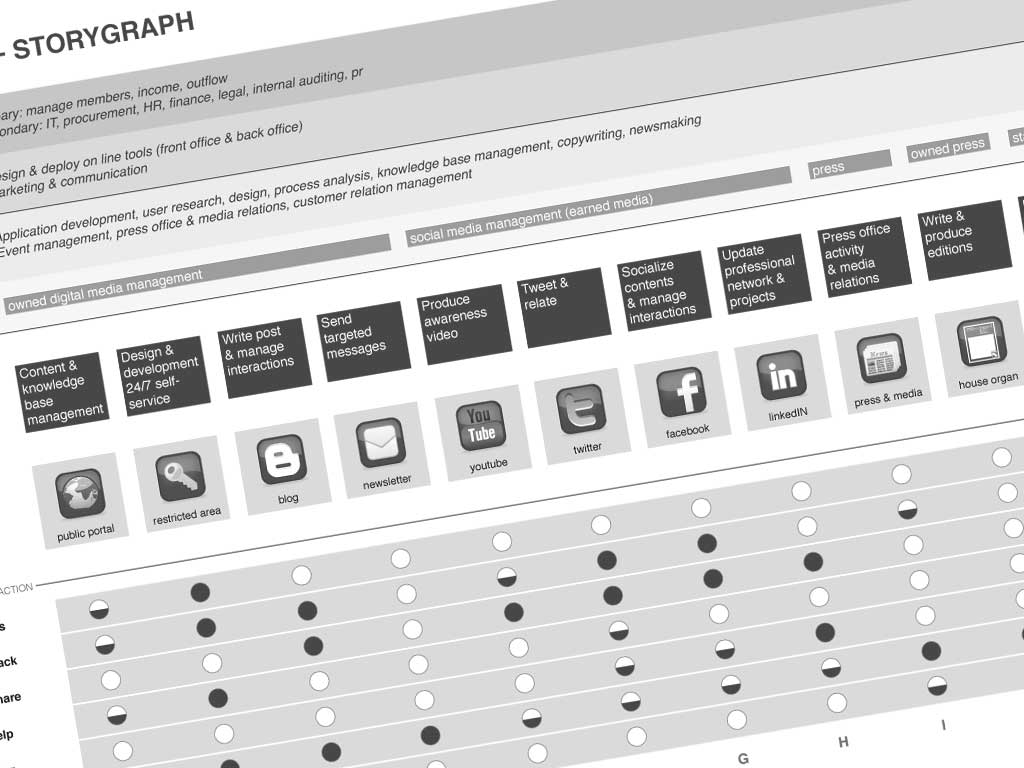
The storygraph is a deliverable I made to visualize the user needs/touchpoint matrix. Then it became a powerful tool, but let’s start from the beginning. Two years ago I was trying to represent how people interact with a whole system, over time and space. Call it by other names: cross-channel experience design, multi-channel service design, More | More Work
If you want to hire me, just drop a line here
-